Palak Gupta👋
Turning data into insights with my Strategic Data Analysis

Turning data into insights with my Strategic Data Analysis

Portfolio Project 6:
The Ola Data Analysis project aimed to examine ride data to uncover patterns in ride frequency, cancellations, ratings, and customer behavior. The goal was to derive actionable insights that could help improve customer experience, optimize operations, and identify key factors influencing user satisfaction and ride performance.
Research:The research phase focused on understanding how Ola’s ride lifecycle works—right from booking and pickup to drop-off and post-ride feedback. Key areas of study included peak demand times, cancellation reasons, trip durations, and customer preferences across city types (urban vs. suburban).
Information Architecture: The dataset was organized into variables such as ride ID, user ID, driver ID, pickup and drop locations, ride type (Micro, Prime, Auto), trip status (completed/cancelled), ride distance, duration, fare amount, and customer rating. The data underwent cleaning (e.g., outlier handling, missing value treatment) and was reshaped to enable visual and predictive analytics.
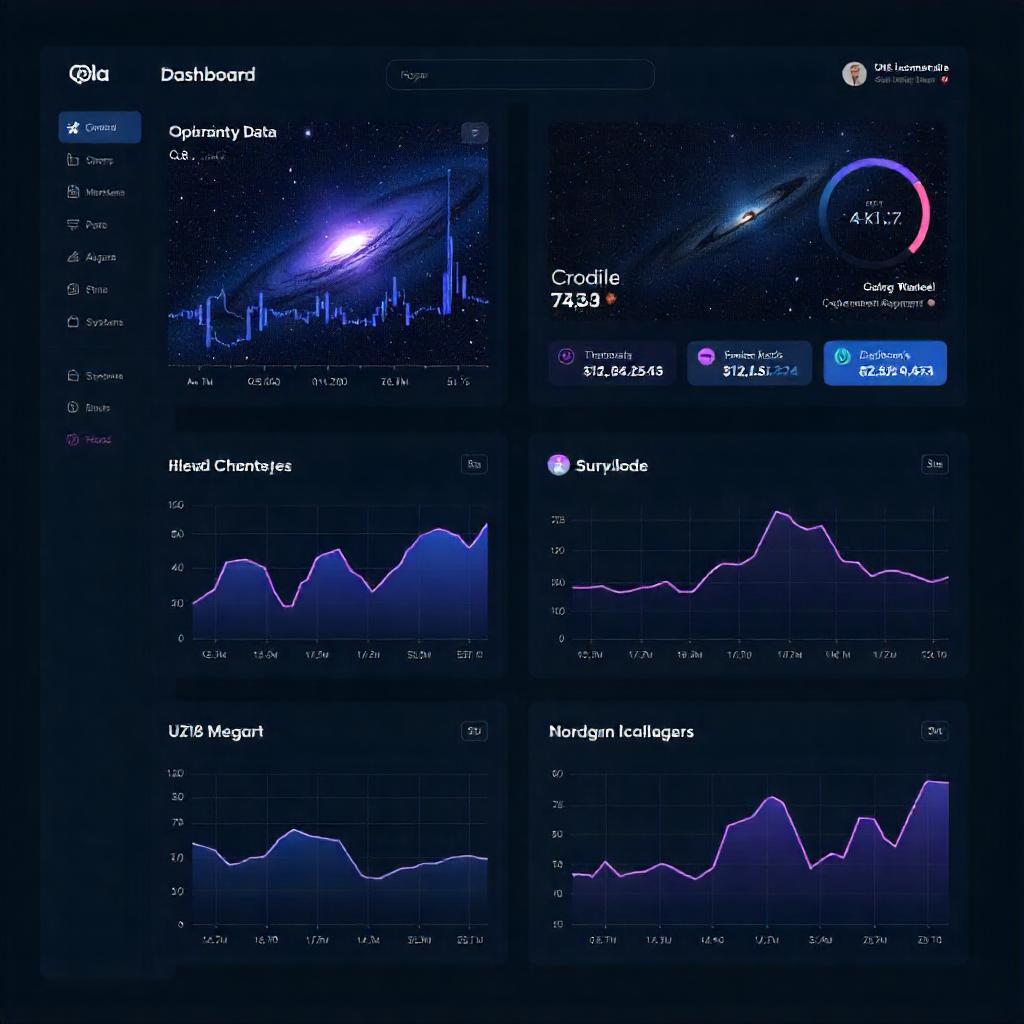
Wireframing and Prototyping: Power BI dashboards and exploratory plots in Python (Matplotlib/Seaborn) were developed. Visuals included hourly heatmaps of ride frequency, bar charts showing top cancellation reasons, and customer churn indicators. Prototypes were made to simulate the impact of fuel prices, peak-hour surcharges, and user satisfaction metrics.
The analysis revealed that weekday morning and weekend evening rides saw the highest demand, with Prime rides having the best customer ratings but also the highest cancellation rates due to longer wait times. A strong correlation was found between trip delays and poor ratings. The insights helped build driver heatmaps for high-demand zones and recommend loyalty programs for frequently returning customers. The project also demonstrated practical skills in geospatial analysis, user segmentation, and operations-focused storytelling. Future extensions could include integrating real-time traffic and weather data to better predict ride delays.


